1st-year teacher and principal survey – effectiveness/impact question
Impact on P-12 Student Learning
Program Completers’ Impact on P-12 Student Learning
A recent program completer wrote to us with the following update:
“My school is a Title 1 school and extremely diverse, with 65% of our enrollment being a minority population, 23% being ELL and 18 different home languages spoken. My students take the NWEA MAP Assessment three times a year. I am extremely proud of the growth I have seen with my class. In math, my class achieved 129% of their projected growth from fall to winter and 133% in reading. 64% of my students scored proficient in math, up from 58%. 59% of my students were proficient in reading by winter, up from 48%. With the education Rockhurst provided me, I am able to implement research-based practices in my classroom that directly impact my students’ performances.”
In addition to data from a recent alum, we collected quantitative data from The Missouri First-Year Educator Survey completed by Teachers’ Principals. This is collected in collaboration by Missouri’s Department of Elementary and Secondary Education (DESE) and The University of Missouri’s Office of Social and Economic Data Analysis (OSEDA). The principal of program completers evaluates first-year teachers’ effectiveness based on the nine Missouri Teacher Standards, the quality of the educator preparation program (EPP), and completers’ impact on student learning. We present RU data alongside statewide data. In 2018, we recognized the data collected by the state was limited since many of our completers teach outside of MO public schools. For example, only 33% of our Rockhurst completers were employed in Missouri public schools during the 2019-2022 timeframe; thus, Missouri public school data below is limited, and so we began collecting additional data. Beginning Spring 2019, we collected (and continue to collect) the same data from principals of our completers in public schools out of the state as well as parochial and private schools. Results from this additional group are included below.
|
In Private, Parochial, and Public Schools Outside of Missouri |
(2019-2022) |
|||
|
Based upon the performance- based evaluation of this first-year teacher, how would you rate his/her impact upon students? |
Ineffective (1) |
Minimally Effective (2) |
Effective (3) |
Highly Effective (4) |
|
0% |
0% |
67% |
33% |
|
|
|
(2016-2018) |
(2019-2022) |
||
|
|
Rockhurst |
Statewide |
Rockhurst |
Statewide |
|
39b. Based upon the performance-based evaluation of this first-year teacher, how would you rate his/her impact upon students? |
|
|
|
|
|
o Ineffective |
0% |
4% |
0% |
3% |
|
o Minimally Effective |
12% |
15% |
22% |
12% |
|
o Effective |
47% |
52% |
44% |
53% |
|
o Highly Effective |
41% |
32% |
33% |
32% |
To assess the impact of program completers with 3-5 years of experience, we designed a research study. Our Institutional Review Board approved our project titled, "Investigating Education Preparation Program Completers’ Impact on K-12 Student Growth". We are using a mixed methods approach, collecting data with Gr 3-12 student surveys developed and validated by the Colorado Initiative and repeating the Missouri 1st year teacher and principal surveys. Data collected as part of this project adds direct and indirect data related to completers’ impact on student learning and growth. We have successfully recruited three completers, their principal, and their students to participate: one elementary education and two secondary completer teachers. Principals (of these teacher completers) rated the teachers as “effective” on impacting student learning. According to K-12 student ratings, completer teachers are positively impacting student growth in the areas of student learning, student-centered environments, classroom community, and classroom management. These K-12 students described their teachers in some of the following ways:
We aim to recruit additional participants during the next academic year cycle.
Completer effectiveness in applying knowledge, skills, and dispositions
Program Completers in the P-12 Classroom: A measure of teacher effectiveness
The following table and line graphs show completer teacher effectiveness data. These summarize the evaluation of Rockhurst University (RU) program completers from the Missouri First-Year Educator Survey completed by Teachers’ Principals with comparison to evaluations of state-wide EPP program completers (MO). The survey includes questions aligned to each Missouri Teacher Standard. All surveys are scored on the following five-point scale: Strongly Agree (5); Agree (4); Neutral (3); Disagree (2); Strongly Disagree (1). In 2018, we recognized the data collected by the state was limited since many of our completers teach outside of MO public schools, For example, only 336% of our Rockhurst completers were employed in Missouri public schools during the 2019-20221 timeframe; thus, Missouri public school data below is limited, and so we began collecting additional data. To obtain a more complete data set, we collected (and continue to collect) the same data from principals of our completers in public schools out of the state as well as parochial and private schools. Results from this additional group, starting Spring 2019, are included below.
| Completers' Indicators of Teaching Effectiveness | |||||
| 2016-2018 | 2019-2022 | 2019-2022 | |||
| Based upon the following scale: Strongly Agree (5); Agree (4); Neutral (3); Disagree (2); Strongly Disagree (1) | RU | MO | RU | MO | RU Completers Outside of MO Public Schools |
| 1. Content knowledge aligned with appropriate instruction | 4.09 | 4.08 | 4.12 | 4.10 | 4.62 |
| 2. Student Learning, Growth, and Development | 3.80 | 3.76 | 3.71 | 3.77 | 4.30 |
| 3. Curriculum Implementation | 4.15 | 4.00 | 3.96 | 4.00 | 4.54 |
| 4. Critical Thinking | 3.92 | 3.90 | 3.90 | 3.92 | 4.67 |
| 5. Positive Classroom Environment | 3.91 | 3.96 | 4.03 | 3.99 | 4.55 |
| 6. Effective Communication | 4.09 | 4.06 | 4.20 | 4.11 | 4.63 |
| 7. Student Assessment and Data Analysis | 3.96 | 3.89 | 4.04 | 3.91 | 4.49 |
| 8. Professionalism | 3.79 | 3.95 | 4.00 | 3.98 | 4.60 |
| 9. Professional Collaboration | 3.92 | 4.02 | 4.15 | 4.04 | 4.67 |
Employer Satisfaction – 1st Year principal data
The following data is from Missouri’s First-Year Educator Survey completed by a Teacher’s Principal. This is collected in collaboration by Missouri’s Department of Elementary and Secondary Education (DESE) and The University of Missouri’s Office of Social and Economic Data Analysis (OSEDA). The principal of program completers evaluates first-year teachers’ effectiveness based on the nine Missouri Teacher Standards, the quality of the educator preparation program (EPP), and completers’ impact on student learning. Below we highlight employers’ satisfaction with their evaluation of the EPP quality. In 2018, we recognized the data collected by the state was limited since many of our completers teach outside of MO public schools. For example, only 33% of our Rockhurst completers were employed in Missouri public schools during the 2019-2022 timeframe; thus, Missouri public school data below is limited, and so we began collecting additional data. To obtain a more complete data set, we collected (and continue to collect) the same data from principals of our completers in public schools out of the state as well as parochial and private schools. Results from this additional group, starting Spring 2019, are included below.
|
Principals in Private, Parochial, and Public Schools outside of Missouri |
18-19, 19-20, 20-21 (2019-2021) |
|||||
|
Please click on the response that best reflects your perspective about the overall quality of the professional education program your teacher completed. |
Very Poor (1) |
Poor (2) |
Fair (3) |
Good (4) |
Very Good (5) |
Average |
|
0% |
0% |
0% |
33% |
67% |
4.66 |
|
|
Principals in Missouri Public Schools |
(2016-2018) |
(2019-2022) |
||
|
|
Rockhurst |
Statewide |
Rockhurst |
Statewide |
|
Please click on the response that best reflects your perspective about the overall quality of the professional education program your teacher completed. |
|
|
|
|
|
o Very Poor (1) |
0% |
2% |
0% |
1% |
|
o Poor (2) |
0% |
4% |
4% |
4% |
|
o Fair (3) |
13% |
14% |
19% |
14% |
|
o Good (4) |
50% |
46% |
44% |
47% |
|
o Very Good (5) |
38% |
34% |
33% |
34% |
Program Completers Satisfaction – 1st year teacher survey
The Missouri First-Year Teacher Survey is distributed annually to initial teacher certification candidates at the conclusion of their first year of teaching in a Missouri public school; italigns with the Missouri Principal of First-Year Teacher Survey. The data provided below is a graphical summary of the scale responses for the Missouri First-Year Teacher Surveys for Rockhurst University graduates and Missouri first-year teacher responses state-wide. The Missouri Survey series has developed scales aligned to each Missouri Quality Indicator standard. This scale format allows for a more robust look at performance around each standard. All surveys are scored on the following five-point scale: Strongly Agree (5); Agree (4); Neutral (3); Disagree (2); Strongly Disagree (1). In 2018, we recognized the data collected by the state was limited since many of our completers teach outside of MO public schools, Thus, we began collecting additional data. For example, only 33% of our Rockhurst completers were employed in Missouri public schools during the 2019-2022 timeframe; thus, Missouri public school data below is limited. To obtain a more complete data set, we collected (and continue to collect) the same data from completers in public schools out of the state as well as parochial and private schools. Results from this additional group, starting Spring 2019, are included below.
| QI1: Content Knowledge | QI2: Learning Growth and Development | QI3: Curriculum Implementation | QI4: Critical Thinking | QI5: Positive Classroom Environment | QI6: Effective Communication | QI7: Student Assessment & Data Analysis | QI8: Professionalism | QI9: Professional Collaboration | Overall Quality of Education Program | |
| RU Completers in MO Public Schools '19-'22 | 4.34 | 3.95 | 4.32 | 4.37 | 4.19 | 4.25 | 3.99 | 4.29 | 4.06 | 4.50 |
| RU Completers outside of MO public schools '19-'22 | 4.38 | 3.78 | 4.27 | 4.49 | 4.40 | 4.38 | 4.00 | 4.31 | 4.38 | 4.38 |
| MO Public Schools- Statewide '19-'22 | 4.15 | 3.77 | 4.15 | 4.16 | 4.08 | 4.12 | 4.01 | 4.12 | 4.00 | 4.16 |
Candidate Competency at Completion
Student Teacher Performance in the P-12 Classroom: A measure of candidate competency at completion
The following table shows a summary of teacher candidate performance on the Missouri Teacher Candidate Summative Assessment (MEES) that is utilized to evaluate teacher candidate performance during the Final Clinical Experience (student teaching). Each Rockhurst University teacher candidate completes one 15-week student teaching placement in an accredited public, private, or parochial school during the Professional Semester. Students work under the close supervision of an experienced cooperating teacher and a Rockhurst University Supervisor, a faculty mentor, who visits the candidate and provides feedback on classroom performance. This evaluation is based upon a scale of 0 to 4, where 0 is the lowest score and 4 is the highest possible score. We do not report Spring 2020 data because it was not collected; the state waived this requirement due to the COVID-19 pandemic.
| Final Summative Scores Across Teacher Candidates | |||||||||
| Fall 2019 | Fall 2020 & Spring 2021 | Fall 2021 & Spring 2022 | |||||||
| Based upon the following scale: 0 = Baseline; 1 = Emerging; 2 = Developing; 3 = Skilled; 4 = Exceeding | Mean Scores | Mean Scores | Mean Scores | ||||||
| Cooperating Teacher | University Supervisor | Average Score Per Indicator | Cooperating Teacher | University Supervisor | Average Score Per Indicator | Cooperating Teacher | University Supervisor | Average Score Per Indicator | |
| 1. Content knowledge aligned with appropriate instruction |
3.67 |
3.78 |
3.73 |
3.74 | 3.74 | 3.74 | 3.62 | 3.59 | 3.60 |
| 2. Student Learning, Growth, and Development | 3.44 | 3.67 | 3.56 | 3.47 | 3.58 | 3.53 | 3.66 | 3.45 | 3.55 |
| 3. Curriculum Implementation | 3.56 | 3.89 | 3.73 | 3.53 | 3.63 | 3.58 | 3.45 | 3.55 | 3.50 |
| 4. Critical Thinking | 3.56 | 3.56 | 3.63 | 3.63 | 3.58 | 3.61 | 3.48 | 3.34 | 3.41 |
| 5. Positive Classroom Environment | 3.89 | 3.67 | 3.78 | 3.68 | 3.68 | 3.68 | 3.62 | 3.59 | 3.60 |
| 6. Effective Communication | 3.56 | 3.67 | 3.62 | 3.74 | 3.74 | 3.74 | 3.55 | 3.52 | 3.53 |
| 7. Student Assessment and Data Analysis | 3.44 | 3.78 | 3.61 | 3.53 | 3.47 | 3.50 | 3.48 | 3.38 | 3.43 |
| 8. Professionalism | 4.00 | 3.89 | 3.95 | 3.68 | 3.68 | 3.68 | 3.59 | 3.52 | 3.55 |
| 9. Professional Collaboration | 4.00 | 3.78 | 3.89 | 3.58 | 3.58 | 3.58 | 3.52 | 3.45 | 3.48 |
* Spring 2020 was affected by COVID-19
The Rockhurst University School of Education teacher candidates must pass the Missouri Content Assessment (MoCA) to be eligible for initial teacher certification. The table below outlines a summary of our teacher candidate pass rates; this aligns with data in the Title II Report.
|
Summary Pass Rates |
|
|
|
|
Missouri Content Assessment |
|
|
|
|
Group |
# taking tests |
# passing tests |
Pass Rate (%) |
| All program completers, 2021-22 | 28 | 26 | 93 |
|
All program completers, 2020-21 |
19 |
17 |
89 |
|
All program completers, 2019-20 |
37 |
37 |
100 |
|
All program completers, 2018-19 |
31 |
30 |
97 |
* The missing 2021-22 was one student who did not report their SSN and so could not be matched for Title II reporting.
Measure 4: Ability of completers to be hired (in positions for which they have prepared.)
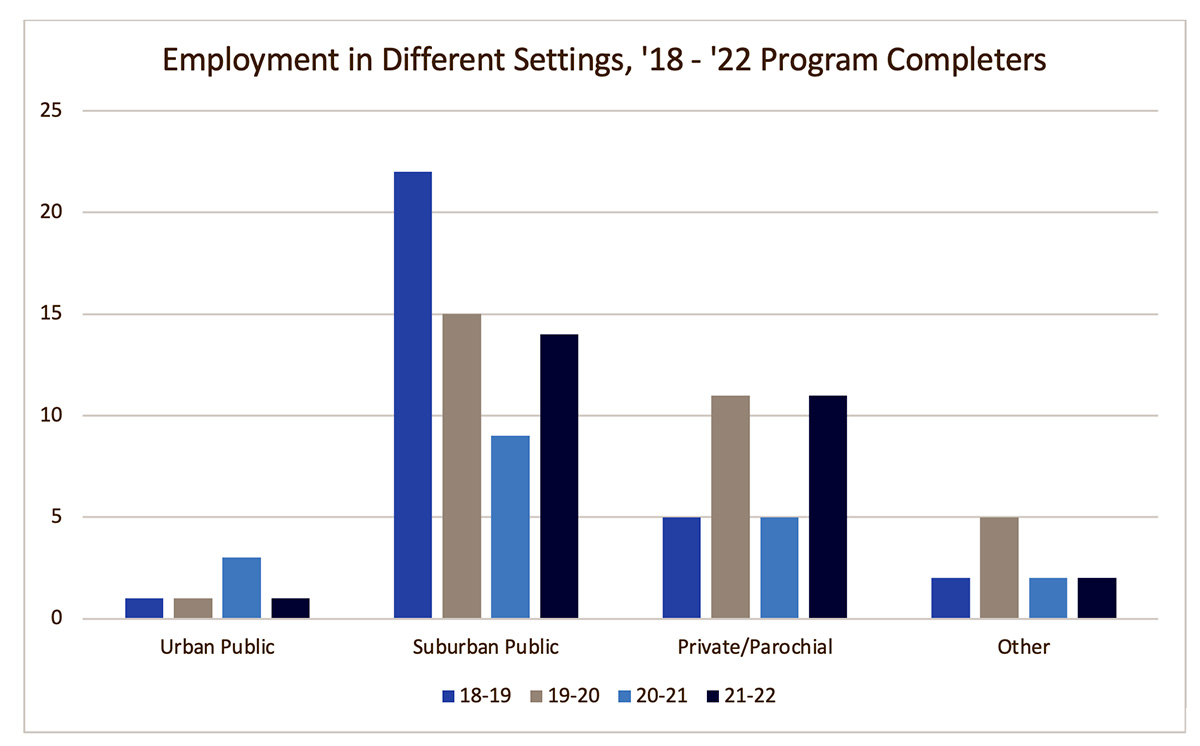
Employment data is a combination of self-report and other publicly available records. 90% (26/29) of AY 21-22 program completers were employed within the are they were prepared to teach immediately after graduation. The two who did not seek employment in the area of teacher certification for which they were prepared pursued education and service-related endeavors. One committed to a year of service and the other began graduate school in mathematics.
|
Employment in Different Settings, Alumni '18-'22 Program Completers |
|||
|
|
'18-19 |
'19-20 |
'20-21 |
|
Urban Public |
1 |
1 |
3 |
|
Suburban Public |
22 |
15 |
9 |
|
Private/Parochial |
5 |
11 |
5 |
|
Other |
2 |
5 |
2 |
The following data is publicly available in a three-year average from the National Student Loan Data System. As default rates are calculated based upon the time a loan enters repayment there is a delay in reporting.
|
School Default Rates FY 2015-2017 |
|
|
|
|
|
|
OPE ID |
School |
|
FY 2015 |
FY 2016 |
FY 2017 |
|
249900 |
Rockhurst University 1100 Rockhurst Road Kansas City, MO 64110 |
Cohort Default Rate |
4.1% |
3.2% |
4.3% |
|
Number in Default |
26 |
20 |
34 |
||
|
Number in Repay |
623 |
614 |
774 |
||
|
Enrollment Figures |
2,825 |
2,854 |
3,043 |
||
To provide context for the Cohort Default Rate (CDR) data we include enrollment data (students enrolled at any time during the year) and a corresponding percentage (borrowers entering repayment divided by that enrollment figure). While there is no direct relationship between the timing of when a borrower entered payment (October 1 through September 30) and any particular enrollment year, for the purpose of these data, we have chosen to use the academic year ending on June 30 prior to the beginning of the cohort year.